
Logging temperature data with Raspberry Pi
This is a follow up post to Reading temperature with Raspberry Pi. In this post I will describe how I changed the initial Python script and added to enable logging and charting of the data.
Requirements
The data will be logged into a SQLite database, using a PHP script to read/write to it. This PHP script will be called from the Python script running on the Raspberry Pi via URL. To display the data a web page will be used, so besides the Raspberry Pi we would be needing the following additional components;
- A web server
- PHP engine
- SQLite3
How to setup the following will not be covered in this post, there is plenty of information available on the web on how to setup Apache, PHP and SQLite.
Since the Raspberry Pi is small machine I did not want to install Apache, PHP and SQLite on it, but I am using the Apache already installed on my company’s server.
Creating SQLite database
Since I haven’t decided on the structure for the final structure of the database, I started out with just two simple tables, one for the sensors and one for the sensor data.
Creating the database file
From the shell/command line execute the following command to create the database file
sqlite3 sensor-data.sqliteCreating the tables
create table sensors( sensor_id        integer primary key autoincrement
                    , sensor_type      text not null
                    , sensor_name      text not null
                    , sensor_location  text not null );
create table sensor_data( id           integer primary key autoincrement
                        , timestamp    datetime default current_timestamp
                        , sensor_id    integer not null
                        , value        real );
BTW: The SQLite database should be placed in the same folder as the HTML page (described in the next session). The folder and SQLite database should be accessible to the Apache web server process, meaning you might have to use chmod and/or chown to correct permissions and ownership.
Adding initial data
Add the sensors to the sensors-table. Only the first sensor we will be using
insert into sensors( sensor_type , sensor_name , sensor_location )
             values( 'TEMPERATURE', 'DS18B20', 'Office' );
insert into sensors( sensor_type , sensor_name , sensor_location )
             values( 'TEMPERATURE', 'DHT22', 'Office' );
insert into sensors( sensor_type , sensor_name , sensor_location )
             values( 'HUMIDITY', 'DHT22', 'Office' );
Check the data
Enter the follow command to display the contents of the sensors-table
select * from sensors;This should return something like this (the first two commands are just to get formatted output)
sqlite> .header on
sqlite> .mode column
sqlite> select * from sensors;
sensor_id   sensor_type  sensor_name  sensor_location
----------  -----------  -----------  ---------------
1           TEMPERATURE  DS18B20      Office
2           TEMPERATURE  DHT22        Office
3           HUMIDITY     DHT22        Office
sqlite>
Exit SQLite
Enter the following command to exit SQLite environment
.quitPHP script for logging
The following PHP script is both used for logging data received from the Raspberry Pi (see logData in the Python script) and is used by the HTML page to fetch data needed for displaying a chart.
<?php
/* SQLite tables*/
define( 'NEWLINE', "\n");

/* Open SQLite connection
*/
$db = new SQLite3( 'sensor-data.sqlite' );

/* Prepared SQLite statements
*/
$stmt_sensor_data = new StdClass();

function process_prepare_statements() {
    global $db, $stmt_sensor_data, $stmt_sensors;

    if ( $db->busyTimeout( 2000 ) ) {
        $stmt_sensor_data = $db->prepare( 'insert into sensor_data( timestamp
                                                                  , sensor_id
                                                                  , value )
                                                            values( datetime( \'now\', \'localtime\' )
                                                                  , :sensor_id
                                                                  , :value )' );
    }
    $db->busyTimeout( 0 );
}

/* Execute SQLite statement with wait for unlocked state (default 10.000 ms
*/
function execute_timeout( $statement, $timeout = 10000 ) {
    global $db;

    if ( $db->busyTimeout( $timeout ) ) {
        $statement->execute();
    }

    $db->busyTimeout( 0 );
}

/* Perform SQLite query with wait for unlocked state (default 6000ms)
*/
function query_timeout( $query, $timeout = 6000 ) {
    global $db;

    if ( $db->busyTimeout( $timeout ) ) {
        $results = $db->query( $query );
    }

    $db->busyTimeout( 0 );

    return $results;
}

/* Log sensor data
*/
function process_log_data( $id, $value ) {
    global $db, $stmt_sensor_data;

    $stmt_sensor_data->bindValue( ':sensor_id', $id, SQLITE3_INTEGER );
    $stmt_sensor_data->bindValue( ':value', $value, SQLITE3_FLOAT );
    execute_timeout( $stmt_sensor_data );
}

/* List sensor data
*/
function process_csv_log_data() {
    $results = query_timeout( "select s.sensor_id, s.sensor_type, s.sensor_name, s.sensor_location, d.timestamp, d.value from sensors s, sensor_data d where s.sensor_id = d.sensor_id and d.timestamp > datetime('now', '-8 hours', 'localtime') order by d.timestamp" );
    header("Content-type: text/csv");
    echo 'timestamp,temperature'.NEWLINE;

    while ( $row = $results->fetchArray( SQLITE3_ASSOC ) ) {
        echo $row['timestamp'];
        echo ',';
        echo $row['value'].NEWLINE;
   }
}

/* Main process
*/
$command = isset( $argv[1] )? $argv[1] : $_GET['action'];

switch( $command )
{
    case 'log_data';
        process_prepare_statements();
        process_log_data( (int)$_GET['id'], (float)$_GET['value'] );
    break;

    case 'csv_data';
        process_csv_log_data();
    break;
}

/* Close SQLite connection
*/
$db->close();
?>
Updated Python script
To log the data I updated the Python script presented in my previous post. The following changes have been made to the script
- New variable has been added
log_host = 'http://www.littlegemsoftware.com/raspberrypi/'- New function has been added
def logData( id, value):
try:
    addr = log_host + 'sensor-data.php?action=log_data&id={0}&value={1}'.format( id, value )
    response = url.urlopen( addr )
    html = response.read()
    return
except:
return- Added call to logData to the endless loop
logData( 1, temp_c )Here is the complete script
#!/usr/bin/env python

import os
import glob
import time
import RPi.GPIO as GPIO
import urllib2 as url

os.system( 'modprobe w1-gpio' )
os.system( 'modprobe w1-therm' )

base_dir = '/sys/bus/w1/devices/'
device_folder = glob.glob( base_dir + '28*' )[0]
device_file = device_folder + '/w1_slave'
log_host = 'http://www.littlegemsoftware.com/raspberrypi/'

GPIO.setmode( GPIO.BCM )
GPIO.setwarnings( False )

def logData( id, value):
    try:
        addr = log_host + 'sensor-data.php?action=log_data&id={0}&value={1}'.format( id, value )
        response = url.urlopen( addr )
        html = response.read()
        return
    except:
        return

def ledMode( PiPin, mode ):
    GPIO.setup( PiPin, GPIO.OUT )
    GPIO.output( PiPin, mode )
    return

def read_temp_raw():
    f = open(device_file, 'r')
    lines = f.readlines()
    f.close()
    return lines

def read_temp():
    lines = read_temp_raw()
    while lines[0].strip()[-3:] != 'YES':
        time.sleep(0.2)
        lines = read_temp_raw()
    equals_pos = lines[1].find('t=')
    if equals_pos != -1:
        temp_string = lines[1][equals_pos+2:]
        temp_c = float(temp_string) / 1000.0
        temp_f = temp_c * 9.0 / 5.0 + 32.0
        return temp_c, temp_f

ledMode( 14, GPIO.LOW )
ledMode( 15, GPIO.LOW )
ledMode( 18, GPIO.LOW )

while True:
    temp_c, temp_f = read_temp()
    ledMode( 14, GPIO.HIGH if temp_c < 27 else GPIO.LOW )
    ledMode( 15, GPIO.HIGH if temp_c >= 27 and temp_c < 29 else GPIO.LOW )
    ledMode( 18, GPIO.HIGH if temp_c >= 29 else GPIO.LOW )
    ts = time.strftime('%Y-%m-%d %H:%M:%S', time.localtime())
    print '{0} - Temperature = {1:.2f} C ({2:.2f} F)'.format( ts, temp_c, temp_f )
    logData( 1, temp_c )
    time.sleep(15)
HTML page to display sensor data
I wanted to display the data using a chart and decided to give D3.js a try. Following is a brief statement from their website
D3.js is a JavaScript library for manipulating documents based on data. D3 helps you bring data to life using HTML, SVG and CSS. D3’s emphasis on web standards gives you the full capabilities of modern browsers without tying yourself to a proprietary framework, combining powerful visualization components and a data-driven approach to DOM manipulation.
For now I will be using the following HTML page to chart the sensor data. If you want to understand all that is happening in the HTML page below, you can find the D3.js documentation over at GitHub.
<html>
<head>
    <meta http-equiv="Content-Type" content="text/html; charset=UTF-8" />
    <title>Raspberry Pi - Sensor Data</title>
    <style>
        body {font: 10px sans-serif; }
        .axis path, .axis line {fill: none; stroke: #000; shape-rendering: crispEdges; }
        .x.axis path {display: none; }
        .y.axis line, .y.axis path {fill: none; stroke: #000; }
        .line {fill: none; stroke: steelblue; stroke-width: 1.5px; }
        .y.axis .tick line {fill: none; stroke: silver; shape-rendering: crispEdges; }
    </style>
</head>
<body>
<script src="http://d3js.org/d3.v3.min.js" charset="utf-8"></script>
<script>
var margin = {
    top: 20,
    right: 50,
    bottom: 30,
    left: 50
},
width = 960 - margin.left - margin.right,
    height = 500 - margin.top - margin.bottom;

var parseDate = d3.time.format("%Y-%m-%d %X").parse;

var x = d3.time.scale()
    .range([0, width]);

var y = d3.scale.linear()
    .range([height, 0]);

var xAxis = d3.svg.axis()
    .scale(x)
    .tickFormat( function(d) { return d3.time.format('%H:%M')(d); } )
    .orient("bottom");

var yAxis = d3.svg.axis()
    .scale(y)
    .tickSize(-width,0,0)
    .tickFormat( d3.format(',.1f') )
    .orient("left");

var yAxis2 = d3.svg.axis()
    .scale(y)
    .tickFormat( d3.format(',.1f') )
    .orient("right");

var line = d3.svg.line()
    .interpolate("basis")
    .x(function (d) { return x(d.timestamp); })

.y(function (d) {
    return y(d.temperature);
});

var svg = d3.select("body").append("svg")
    .attr("width", width + margin.left + margin.right)
    .attr("height", height + margin.top + margin.bottom)
    .append("g")
    .attr("transform", "translate(" + margin.left + "," + margin.top + ")");

d3.csv("/raspberrypi/sensor-data.php?action=csv_data", function (error, data) {
    data.forEach(function (d) {
        d.timestamp = parseDate(d.timestamp);
        d.temperature = +d.temperature;
    });

    x.domain(d3.extent(data, function (d) {return d.timestamp; }));
    y.domain( [ d3.min(data, function (d) {return d.temperature; })-0.1
              , d3.max(data, function (d) {return d.temperature; })+0.1
              ] ).nice();

    svg.append("g")
        .attr("class", "x axis")
        .attr("transform", "translate(0," + height + ")")
        .call(xAxis);

    svg.append("g")
        .attr("class", "y axis")
        .call(yAxis)
        .append("text")
        .attr("transform", "rotate(-90) translate(0,-50)")
        .attr("y", 6)
        .attr("dy", ".71em")
        .style("text-anchor", "end")
        .text("Temperature (°C)");

    svg.append("g")
        .attr("class", "y2 axis")
        .attr("transform", "translate(" + width + " ,0)")
        .call(yAxis2)
        .append("text")
        .attr("transform", "rotate(90) translate(0, -50)")
        .attr("y", 6)
        .attr("dy", ".71em")
        .style("text-anchor", "start")
        .text("Temperature (°C)");

    svg.append("path")
        .datum(data)
        .attr("class", "line")
        .attr("d", line);
});
</script>
</body>
</html>
The Results
Based on the HTML above and the data collected by the Raspberry Pi, the following chart is presented. Still not perfect, but it gets the job done.
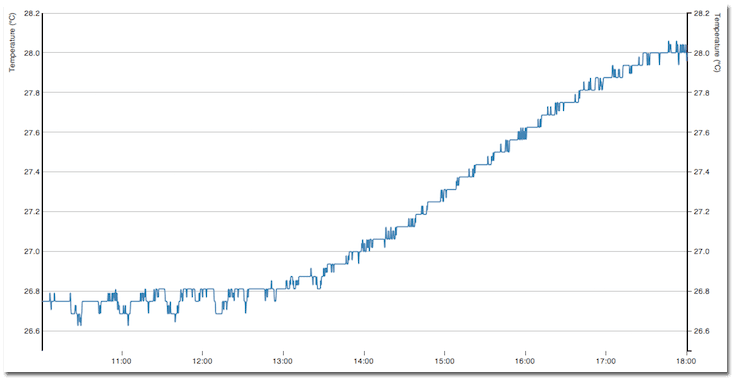 Charted sensor data
Next Steps
Over time when more sensors are added to the Raspberry Pi the SQLite database will most likely be replaced with a MySQL or PostgreSQL database. This will give more flexibility, certainly when it comes to being able to read and write to the same table (i.e. logging data and charting simultaneously). Also the data model itself will be improved to make it easier
For the web part of it the ability to select the sensor will be added. Might even add a floor plan showing the current sensor data, but that would only make sense when more Raspberry Pi’s or remote sensors are added.