
Adding a DHT sensor to the Raspberry Pi
Today I received a new sensor in the mail that I had ordered from Kiwi Electronics. Time to hook it up….
Adding the sensor to the Raspberry Pi
The sensor that I bought is a AM2302 (which is a wired version of the DHT22 sensor). It has three wires, a red (VDD, power), yellow (Data signal) and black (GND) one. Based on this info, I made the following connections
- Connect the red wire to pin 1 (3v3)
- Connect the black wire to pin 6 (Ground)
- Connect the yellow wire to pin 15 (GPIO 22), but any free GPIO port should do
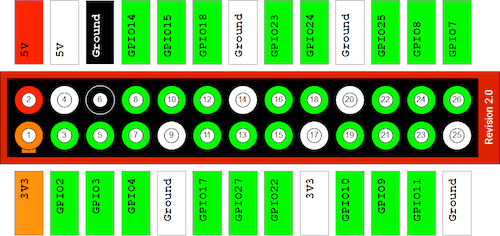 Layout GPIO pins
Installing Required Software
The nice people over at Adafruit provide a nice tutorial and software for hooking a DHT Temperature/Humidity sensor to a Raspberry Pi. So for my project I followed the instructions detailed in the Software Install section of the tutorial.
Grabbing the Adafruit code from GitHub
git clone git://github.com/adafruit/Adafruit-Raspberry-Pi-Python-Code.git
cd Adafruit-Raspberry-Pi-Python-Code
cd Adafruit_DHT_Driver
After this you can already try to get a reading from the sensor, by running the following command
sudo ./Adafruit_DHT 2302 4where 2302 is the type of sensor 22 is GPIO pin
This should give results like the following. If the output stops at Data (..) ...., just wait a couple of seconds and try again.
pi@raspberrypi ~/raspberrypi $ sudo ./Adafruit_DHT 2302 22
Using pin #22
Data (40): 0x1 0xc1 0x1 0x1c 0xdf
Temp =  28.40 *C, Hum = 44.90 %
in the case you get the following results, check you wiring
pi@raspberrypi ~/raspberrypi $ sudo ./Adafruit_DHT 2302 22
Using pin #22
Data (0): 0x0 0x0 0x0 0x0 0x0
Optionally you can also follow the instructions for ‘Adapting the DHT C code’, just to be on the safe side I did.
Updating the Python logging script
Two additional modules are needed
import re
import subprocess
New function to read out the data from the sensor (The answer to the Ultimate Question of Life, the Universe, and Everything)
def read_dht22( PiPin ):
    output = subprocess.check_output(["./Adafruit_DHT", "2302", str(PiPin)])
    matches = re.search("Temp =\s+([0-9.]+)", output)
    if ( matches ):
        logData( 2, float(matches.group(1)) )
    matches = re.search("Hum =\s+([0-9.]+)", output)
    if ( matches ):
        logData( 3, float(matches.group(1)) )
    return
In the endless loop call the new function
read_dht22(22)Full version of the script
#!/usr/bin/env python

import os
import glob
import time
import RPi.GPIO as GPIO
import urllib2 as url
import re
import subprocess

os.system( 'modprobe w1-gpio' )
os.system( 'modprobe w1-therm' )

base_dir = '/sys/bus/w1/devices/'
device_folder = glob.glob( base_dir + '28*' )[0]
device_file = device_folder + '/w1_slave'
log_host = 'http://www.littlegemsoftware.com/raspberrypi/'

GPIO.setmode( GPIO.BCM )
GPIO.setwarnings( False )

def logData( id, value):
    try:
        addr = log_host + 'sensor-data.php?action=log_data&id={0}&value={1}'.format( id, value )
        response = url.urlopen( addr )
        html = response.read()
        return
    except:
        return

def ledMode( PiPin, mode ):
    GPIO.setup( PiPin, GPIO.OUT )
    GPIO.output( PiPin, mode )
    return

def read_temp_raw():
    f = open(device_file, 'r')
    lines = f.readlines()
    f.close()
    return lines

def read_dht22( PiPin ):
    output = subprocess.check_output(["./Adafruit_DHT", "2302", str(PiPin)])
    matches = re.search("Temp =\s+([0-9.]+)", output)
    if ( matches ):
        logData( 2, float(matches.group(1)) )
    matches = re.search("Hum =\s+([0-9.]+)", output)
    if ( matches ):
        logData( 3, float(matches.group(1)) )
    return

def read_temp():
    lines = read_temp_raw()
    while lines[0].strip()[-3:] != 'YES':
        time.sleep(0.2)
        lines = read_temp_raw()
    equals_pos = lines[1].find('t=')
    if equals_pos != -1:
        temp_string = lines[1][equals_pos+2:]
        temp_c = float(temp_string) / 1000.0
        temp_f = temp_c * 9.0 / 5.0 + 32.0
        return temp_c, temp_f

ledMode( 14, GPIO.LOW )
ledMode( 15, GPIO.LOW )
ledMode( 18, GPIO.LOW )

while True:
    temp_c, temp_f = read_temp()
    ledMode( 14, GPIO.HIGH if temp_c < 27 else GPIO.LOW )
    ledMode( 15, GPIO.HIGH if temp_c >= 27 and temp_c < 29 else GPIO.LOW )
    ledMode( 18, GPIO.HIGH if temp_c >= 29 else GPIO.LOW )
    ts = time.strftime('%Y-%m-%d %H:%M:%S', time.localtime())
    print '{0} - Temperature = {1:.2f} C ({2:.2f} F)'.format( ts, temp_c, temp_f )
    logData( 1, temp_c )
    read_dht22(22)
    time.sleep(30)
Updating the PHP script
When calling the script with action=csv_data, two additional parameters are required. id for the ID within the sensors-table and period for the numbers of hours worth of data should be returned
<?php
/* ============================================================================ */
/* SQLite tables                                                                */
/* ============================================================================ */
    define( 'NEWLINE', "\n");

/* ============================================================================ */
/* Open SQLite connection                                                       */
/* ============================================================================ */
    $db = new SQLite3( 'sensor-data.sqlite' );

/* ============================================================================ */
/* Prepared SQLite statements                                                   */
/* ============================================================================ */
    $stmt_sensor_data = new StdClass();
    $stmt_sensors = new StdClass();

    function process_prepare_statements() {
        global $db, $stmt_sensor_data, $stmt_sensors;

        if ( $db->busyTimeout( 2000 ) ) {
            $stmt_sensors = $db->prepare( 'insert into sensors( sensor_type
                                                              , sensor_name
                                                              , sensor_location )
                                                        values( :sensor_type
                                                              , :sensor_name
                                                              , :sensor_location )' );

            $stmt_sensor_data = $db->prepare( 'insert into sensor_data( timestamp
                                                                      , sensor_id
                                                                      , value )
                                                                values( datetime( \'now\', \'localtime\' )
                                                                      , :sensor_id
                                                                      , :value )' );
        }
        $db->busyTimeout( 0 );
    }

/* ============================================================================ */
/* Execute SQLite statement with wait for unlocked state (default 10.000 ms     */
/* ============================================================================ */
    function execute_timeout( $statement, $timeout = 10000 ) {
        global $db;

        if ( $db->busyTimeout( $timeout ) ) {
            $statement->execute();
        }

        $db->busyTimeout( 0 );
    }

/* ============================================================================ */
/* Perform SQLite query with wait for unlocked state (default 6000ms)           */
/* ============================================================================ */
    function query_timeout( $query, $timeout = 6000 ) {
        global $db;

        if ( $db->busyTimeout( $timeout ) ) {
            $results = $db->query( $query );
        }

        $db->busyTimeout( 0 );

        return $results;
    }

/* ============================================================================ */
/* Log sensor data                                                              */
/* ============================================================================ */
    function process_log_data( $id, $value ) {
        global $db, $stmt_sensor_data;

        $stmt_sensor_data->bindValue( ':sensor_id', $id, SQLITE3_INTEGER );
        $stmt_sensor_data->bindValue( ':value', $value, SQLITE3_FLOAT );
        execute_timeout( $stmt_sensor_data );
    }

/* ============================================================================ */
/* List sensor data                                                             */
/* ============================================================================ */
    function process_csv_log_data( $sensor, $period ) {
        $results = query_timeout( "select s.sensor_id
                                   ,      s.sensor_type
                                   ,      s.sensor_name
                                   ,      s.sensor_location
                                   ,      d.timestamp
                                   ,      d.value
                                   from   sensors s
                                   ,      sensor_data d
                                   where  s.sensor_id = ${sensor}
                                   and    s.sensor_id = d.sensor_id
                                   and    d.timestamp > datetime('now', '-${period} hours', 'localtime')
                                   order by d.timestamp" );
        header("Content-type: text/csv");
        echo 'timestamp,temperature'.NEWLINE;

        while ( $row = $results->fetchArray( SQLITE3_ASSOC ) ) {
            echo $row['timestamp'];
            echo ',';
            echo $row['value'].NEWLINE;
       }
    }

/* ============================================================================ */
/* Main process                                                                 */
/* ============================================================================ */
    $command = isset( $_GET['action'] )? $_GET['action'] : 'UNKNOWN_COMMAND';

    switch( $command )
    {
        case 'log_data';
            process_prepare_statements();
            process_log_data( (int)$_GET['id'], (float)$_GET['value'] );
        break;

        case 'csv_data';
            $id = (int)$_GET['id'];
            $period = (int)$_GET['period'];
            process_csv_log_data( $id, $period );
        break;
    }

/* ============================================================================ */
/* Close SQLite connection                                                      */
/* ============================================================================ */
    $db->close();
?>
Updating the HTML page
To the HTML I added the necessary code so it could display three charts simultaneously. After the changes the code looked a bit crowded, to resolve this I moved pieces of code to separate files. Now every part has its own file, CSS, HTML and JavaScript/jQuery.
HTML page
<html>
    <head>
        <meta http-equiv="Content-Type" content="text/html; charset=UTF-8" />
        <title>Raspberry Pi - Sensor Data</title>
        <link rel="shortcut icon" href="./favicon.ico" type="image/vnd.microsoft.icon"/>
        <link rel="icon" href="./favicon.ico" type="image/x-ico"/>
        <link rel="stylesheet" href="./chart-sensor.css" type="text/css" />
        <script type="text/javascript" src="http://d3js.org/d3.v3.min.js" charset="utf-8"></script>
        <script type="text/javascript" src="./chart-sensor.js" charset="utf-8"></script>
    </head>
<body>
    <h2>DS18B20 - Temperature</h2>
    <div class="ds18b20"></div>

    <h2>DHT22 / AM2302 - Temperature</h2>
    <div class="dht22temp"></div>

    <h2>DHT22 / AM2302 - Humidity</h2>
    <div class="dht22hum"></div>

    <script type="text/javascript">
        showChart( "div.ds18b20", 1, 8, "Temperature (°C)" );
        showChart( "div.dht22temp", 2, 8, "Temperature (°C)" );
        showChart( "div.dht22hum", 3, 8, "Humidity (%)" );
    </script>
</body>
</html>
CSS
body {
  font: 10px sans-serif;
  background: rgb(238, 238, 238);
}

h2 {
  font-family: Arial, Helvetica, sans-serif;
}

.axis path,
.axis line {
  fill: none;
  stroke: #000;
  shape-rendering: crispEdges;
}

.x.axis path {
  display: none;
}

.y.axis line, .y.axis path {
  fill: none;
  stroke: #000;
}

.line {
  fill: none;
  stroke: steelblue;
  stroke-width: 1.5px;
}

.y.axis .tick line {
  fill: none;
  stroke: silver;
  shape-rendering: crispEdges;
}

.ds18b20, .dht22temp, .dht22hum {
    display: table-cell;
    background-color: rgb(245, 245, 245);
    -webkit-border-radius: 3px;
    -moz-border-radius: 3px;
    border-radius: 3px;
    -webkit-box-shadow: 2px 2px 2px rgba(0, 0, 0, 0.3);
    -moz-box-shadow:    2px 2px 2px rgba(0, 0, 0, 0.3);
    box-shadow:         2px 2px 2px rgba(0, 0, 0, 0.3);
    padding: 10px;
}
JavaScript
showChart = function( area, sensor, period, unit ) {
    var margin = {top: 20, right: 50, bottom: 30, left: 50 },
        width = 700 - margin.left - margin.right,
        height = 250 - margin.top - margin.bottom;

    var parseDate = d3.time.format("%Y-%m-%d %X").parse;

    var x = d3.time.scale()
        .range([0, width]);

    var y = d3.scale.linear()
        .range([height, 0]);

    y.ticks(0.1);

    var xAxis = d3.svg.axis()
        .scale(x)
        .tickFormat( function(d) { return d3.time.format('%H:%M')(d); } )
        .orient("bottom");

    var yAxis = d3.svg.axis()
        .scale(y)
        .tickSize(-width,0,0)
        .tickFormat( d3.format(',.1f') )
        .orient("left");

    var yAxis2 = d3.svg.axis()
        .scale(y)
        .tickFormat( d3.format(',.1f') )
        .orient("right");

    var line = d3.svg.line()
        .interpolate("basis")
        .x(function (d) { return x(d.timestamp); })

    .y(function (d) {
        return y(d.temperature);
    });

    var svg = d3.select( area ).append("svg")
        .attr("width", width + margin.left + margin.right)
        .attr("height", height + margin.top + margin.bottom)
        .append("g")
        .attr("transform", "translate(" + margin.left + "," + margin.top + ")");

    d3.csv("/raspberrypi/sensor-data.php?action=csv_data&id="+sensor+"&period="+period, function (error, data) {
        data.forEach(function (d) {
            d.timestamp = parseDate(d.timestamp);
            d.temperature = +d.temperature;
        });

        x.domain(d3.extent(data, function (d) {return d.timestamp; }));
        y.domain( [d3.min(data, function (d) {return d.temperature; })-0.1,d3.max(data, function (d) {return d.temperature; })+0.1] ).nice();

        svg.append("g")
            .attr("class", "x axis")
            .attr("transform", "translate(0," + height + ")")
            .call(xAxis);

        svg.append("g")
            .attr("class", "y axis")
            .call(yAxis)
            .append("text")
            .attr("transform", "rotate(-90) translate(0,-50)")
            .attr("y", 6)
            .attr("dy", ".71em")
            .style("text-anchor", "end")
            .text(unit);

        svg.append("g")
            .attr("class", "y2 axis")
            .attr("transform", "translate(" + width + " ,0)")
            .call(yAxis2)
            .append("text")
            .attr("transform", "rotate(90) translate(0, -50)")
            .attr("y", 6)
            .attr("dy", ".71em")
            .style("text-anchor", "start")
            .text(unit);

        svg.append("path")
            .datum(data)
            .attr("class", "line")
            .attr("d", line);
    });
};
Final Results
And this is what it looks like when it all comes together
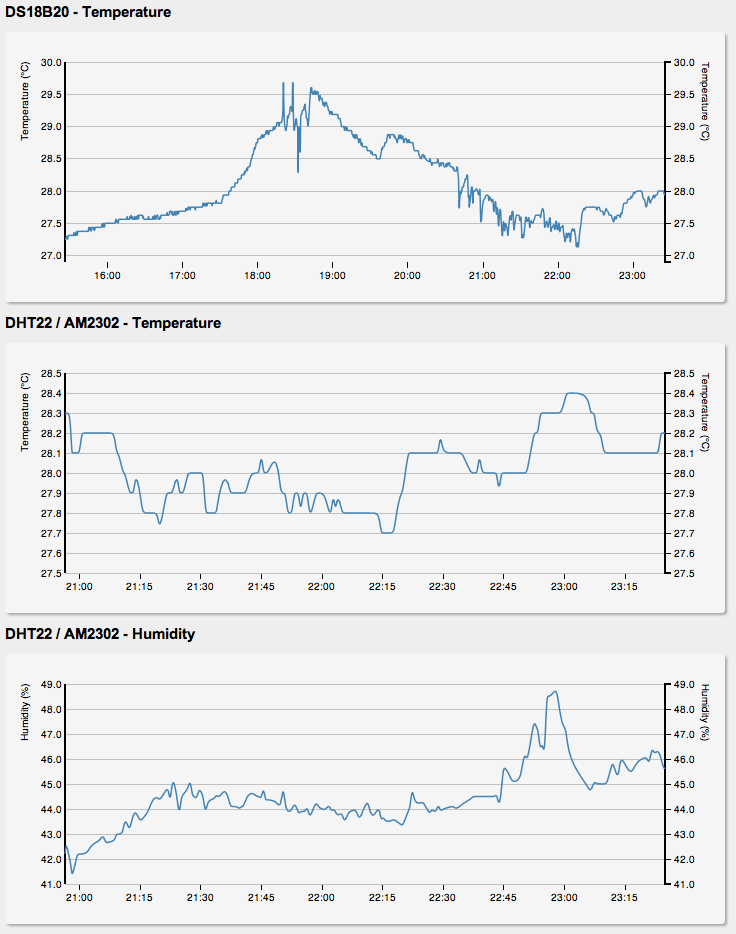 Sensors in three charts